This is a collection of some basic R commands. R is a completely different system than Euler with advanced object data types, which Euler does not provide. For Euler's way to do things in statistcs see the following notebook.
However, it might be nice to translate some functionality to Euler.
>load r
Implements some R Commands in Euler (very incompletely).
We cannot define the <- operator for assignments. It might be interesting to add this to the kernel of Euler, however. So we keep using := or =.
>x := c(4,5,6,8,9,4,5,2)
[4, 5, 6, 8, 9, 4, 5, 2]
The summary function computes some quantiles.
>summary(x)
Min: 2
1st: 4
Med: 5
Mea: 5.375
3rd: 6.5
Max: 9
The following is a nice function, which is implemented in Euler in a vary simple way.
function rep(v,n) := redim(dup(v,n),n*cols(v));
>rep(1:3,5)
[1, 2, 3, 1, 2, 3, 1, 2, 3, 1, 2, 3, 1, 2, 3]
It can also work like multdup in Euler.
>rep(c(1,4,5),c(2,3,2))
[1, 1, 4, 4, 4, 5, 5]
The seq function works much like the : operator.
>seq(1,10)
[1, 2, 3, 4, 5, 6, 7, 8, 9, 10]
>seq(1,10,2)
[1, 3, 5, 7, 9]
But it can also work like linspace.
>seq(1,10,length=5)
[1, 3.25, 5.5, 7.75, 10]
The matrix function exists in Euler in a different meaning. We do not want to overload it, so we call it matr.
>shortformat; matr(1:10,2)
        1         6
        2         7
        3         8
        4         9
        5        10
>matr(1:10,ncol=5)
        1         3         5         7         9
        2         4         6         8        10
>matr(1:10,ncol=5,>byrow)
        1         2         3         4         5
        6         7         8         9        10
The | and _ operators are functions in R.
>cbind(1:3,4)
        1         4
        2         4
        3         4
>rbind(1:3,4)
        1         2         3
        4         4         4
We can mimic the apply function.
>apply(cbind(1:6,2:7),2,"mean")
[3.5, 4.5]
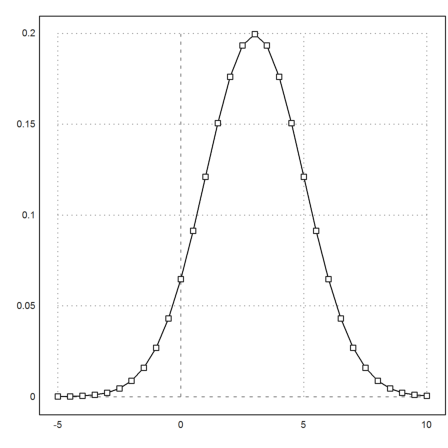
R knows lots of distributions. For the plotting command, see below.
>x=seq(-5,10,0.5); rplot(x,dnorm(x,3,2),"b"):
The distribution of Gauß is called pnorm, and the quantile (inverse distribution) is called qnorm.
>qnorm(pnorm(1,0,2),0,2)
1
The default is the N(0,1) distribution.
>qnorm(0.99)
2.32635
>v:=rnorm(100000); mean(v), dev(v)
0.000592833
0.997914
R uses a plot command with some parameters. Since we cannot overwrite Eulers plot, we call the plot function rplot().
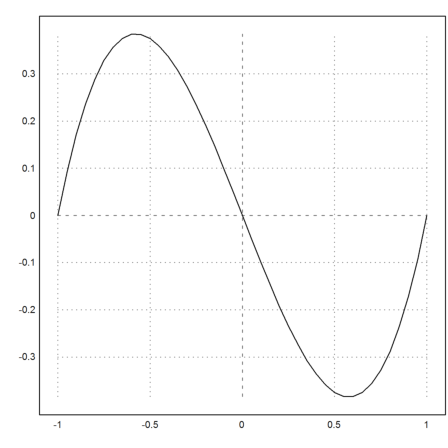
The parameters allow the default point plots "p", line plots "l", both "b", histogram plots "h", and surface plots "s".
>x:=seq(-1,1,0.05); rplot(x,x^3-x,"l"):
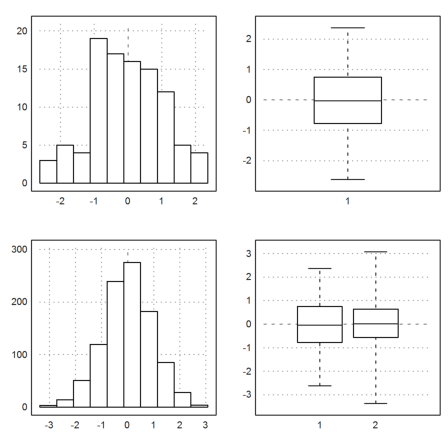
>x1=rnorm(100); x2=rnorm(1000); ...
 par(mfrow=c(2,2)); ...
 rhist(x1); rboxplot(x1); ...
 rhist(x2); rboxplot(x1,x2):
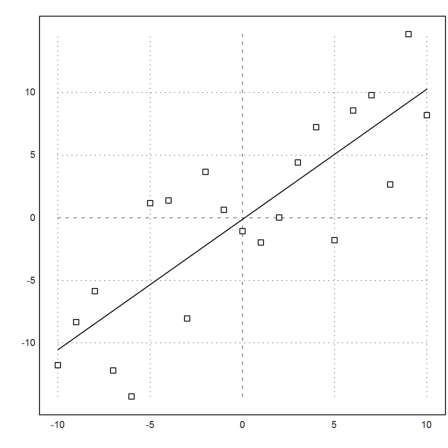
>par(mfcol=c(1,1)); ...
 x:=seq(-10,10); ...
 y:=x+rnorm(length(x),0,4); ...
 rplot(x,y); p=polyfit(x,y,1); abline(p):